
Moon Clock
Auroral Activity
This page is a summary of information from my aurora monitoring network at home, as well as gathering data from other sources.
Geomagnetic/Auroral Activity for past 24 hours
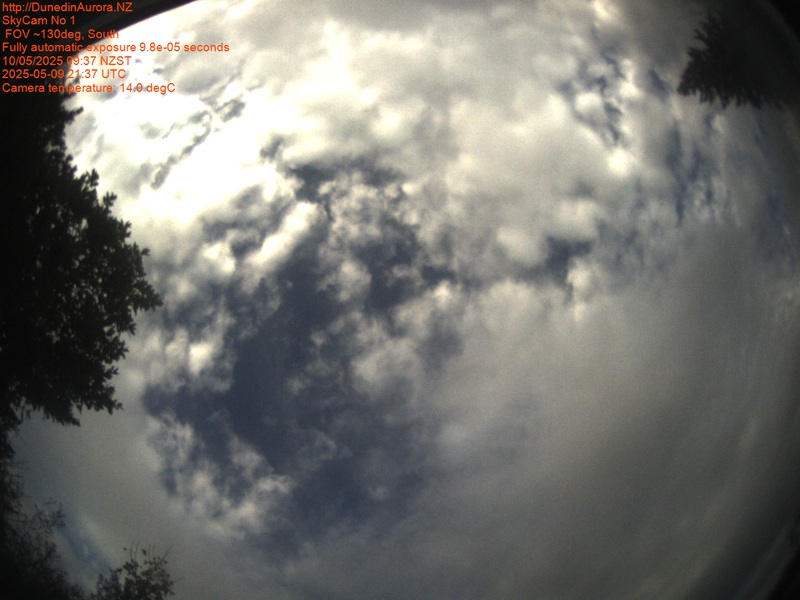
SkyCam
Magnetic Activity
Aurora present themselves in times of increased activity. By looking at how much each reading has changed from the previous one, we can get a sense of how busy the geomagnetic field is becoming. The grey max/min guidelines show how turbulent the geomagnetic field has been in chunks of an hour, and can be thought of as a more detailed version of the K-index.
Magnetometer Network
This is an aggregate feed from 3 magnetometers based in Dunedin. Two are at Ruru Observatory, and one is located 6.5km away. This can provide quick visual confirmation if magnetic changes are local noise or genuine.
One Hour - Rapid Run Magnetogram
A full 24 hour magnetogram from this device is available here
Historically, magnetometer records used to be created by tracking a dot of light on photographic paper wrapped around a rotating drum. Fine-scale pulsations present when an aurora is active were blurred when recorded this way. Faster rotation of the photographic drum stretched out the time-scale and showed these fine details. The specialised magnetometer at Ruru Observatory is an electronic version that can show the signature pulsations present at the beginning of sub-storms, and when rays, beams, and brightening of the aurora occur.